Five decades, every doubling, a fifth off
The price of a solar module has followed a single statistical line for half a century — not because of any one invention, but because every time the industry made twice as many panels as it ever had, it found a way to make them for about twenty per cent less.
The line that refused to break
From the 1970s, analysts tracking photovoltaic costs noticed that module prices were behaving the way semiconductor prices had been behaving for years: each time cumulative production doubled, costs fell by a roughly constant fraction. They kept watching. Decade after decade, the data held. The solar learning rate — the cost reduction associated with each doubling of cumulative installed capacity — has been estimated at around 20–23 per cent across the full period, a figure that the International Energy Agency and IRENA have both cited in their tracking reports. Richard Swanson, founder of the solar manufacturer SunPower, later popularised the pattern, which became known informally as Swanson's Law, though it describes a statistical regularity, not a mechanism.
What makes this striking is not the percentage — learning curves appear across manufacturing generally — but the duration and the scale of what has been learned. In 1976, a watt of photovoltaic module capacity cost roughly 100 US dollars. By 2023, utility-scale module prices had fallen below 0.20 dollars per watt, a reduction of more than 99 per cent across more than twenty doublings of cumulative production. Each of those doublings, starting from a tiny base, took years; the later ones, from an already large base, took less calendar time even though they required far more production volume. The line remained.
What the curve is actually measuring
A learning curve is not a theory about how cost reduction happens. It is an empirical record that it has happened, repeatedly. The mechanisms are various and they overlap: manufacturing yields improve as workers and equipment accumulate experience; engineers find ways to use less material per unit; supply chains deepen and become more competitive; financing costs fall as the technology becomes legible to lenders; and occasionally a genuine process innovation cuts a step or replaces an expensive input.
Silicon consumption per cell is a concrete example. Early cells used thick wafers cut with wire saws that wasted nearly as much silicon as they kept. Over decades, the industry thinned the wafer, improved the wire, and reduced kerf loss — the material turned to dust by the saw. The National Renewable Energy Laboratory in Colorado has tracked successive generations of cell efficiency and manufacturing cost, documenting how process improvements at cell level compounded with improvements at module assembly level and at the level of the whole supply chain. The Fraunhofer Institute for Solar Energy Systems in Freiburg, Germany, has published similar analyses for the European market, and the numbers from both institutions align closely with the long-run learning rate described above.
None of this is automatic. Every doubling of production required capital investment, market development and, in most decades, some form of policy support that created the demand for the next doubling. Feed-in tariff programs in Germany in the 2000s, production tax credits in the United States, and aggressive procurement by Chinese manufacturers in the 2010s each accelerated different segments of the curve. The curve recorded what followed; it did not cause it.
Where the doublings happened
The geography of production shifted dramatically as the curve progressed. Through the 1980s and 1990s, Japan — Sharp, Kyocera, Sanyo — led module manufacturing. The United States and Germany maintained significant positions. Then, from roughly 2005 onward, Chinese manufacturers scaled with a speed that had no precedent in the industry's history, moving from negligible market share to supplying the majority of global modules within a decade. By the early 2020s, Chinese manufacturers accounted for well over 80 per cent of global solar panel production by volume.
That concentration matters for understanding the curve. The cost reductions since 2010 reflect, partly, genuine manufacturing learning and process improvement, and partly the economics of building very large factories in a location with lower labor costs, aggressive financing and strong domestic policy support. Disentangling these contributions is difficult. What the learning curve records is the aggregate outcome: prices fell, production rose, and the ratio between the two has remained statistically consistent.
The geography of production shifted dramatically as the curve progressed.
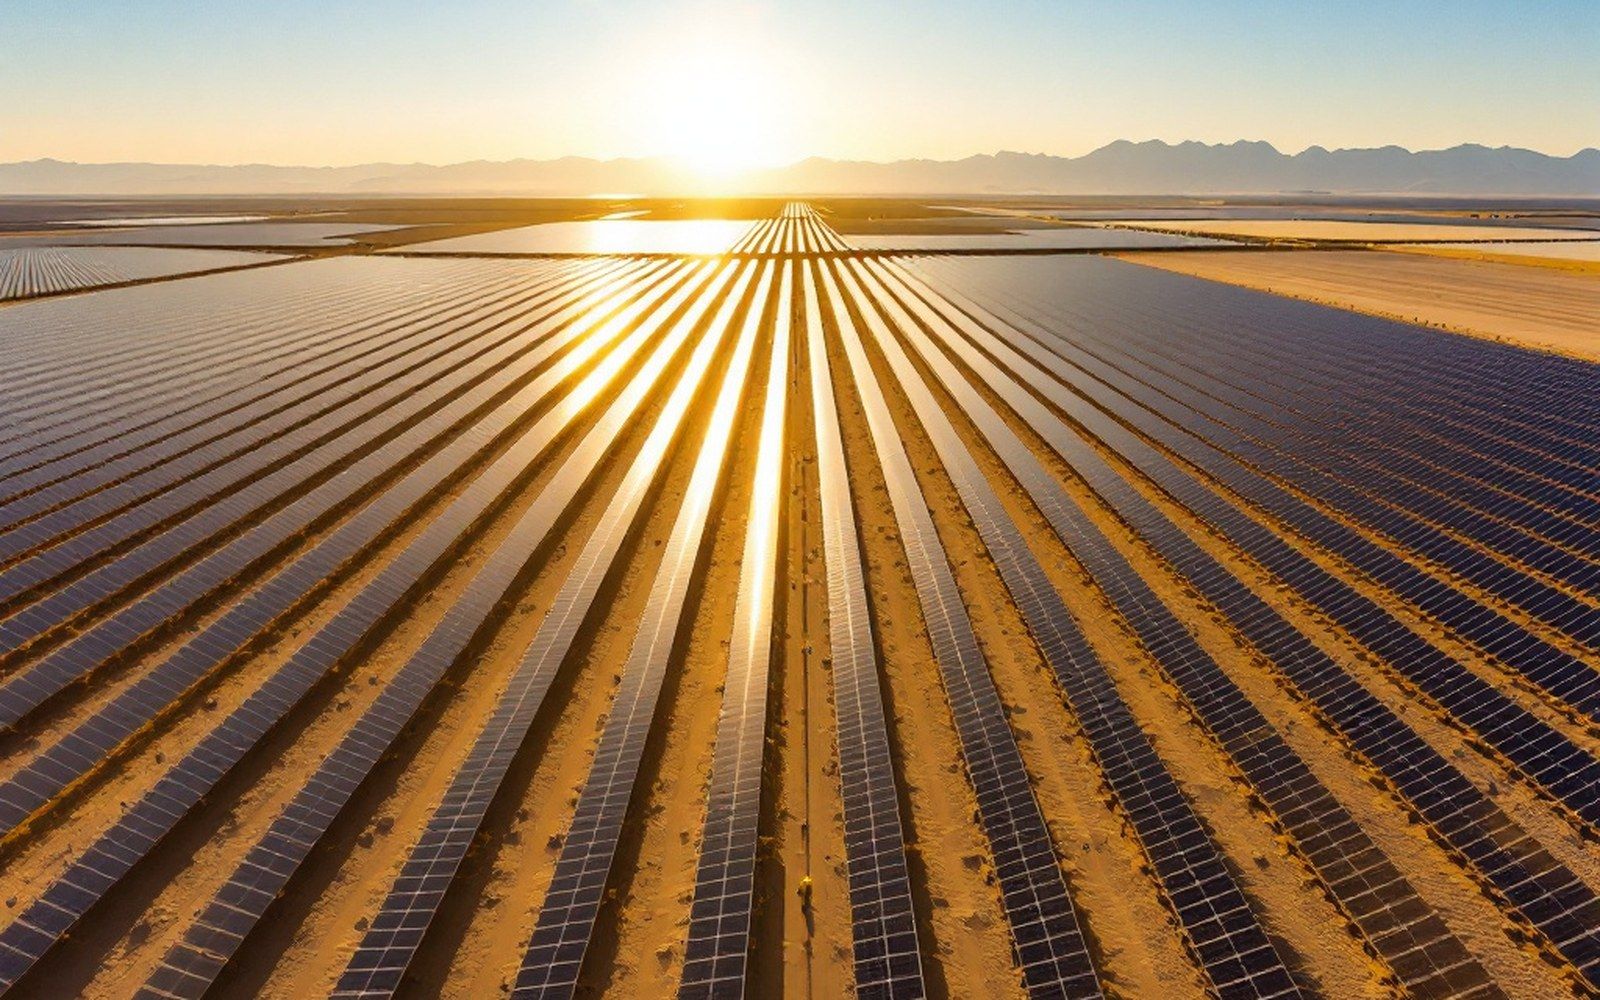
The demand side moved the doublings along. Al Dhafra in Abu Dhabi, where a 2 GW project was contracted at a price that became the world's cheapest solar electricity at the time it was signed, and Bhadla in Rajasthan, where 2,245 MW was built across 14,000 acres, represent the scale at which the industry now operates. Projects like these, repeated globally, are what each successive doubling of cumulative production looks like from the ground.
The limits of extrapolation
The learning curve has survived every prediction that it was about to flatten. It survived the transition from amorphous silicon to crystalline silicon cells. It survived the end of the feed-in tariff era in Europe. It survived repeated forecasts from analysts — including, on occasion, the IEA itself — that were too conservative about how far costs would fall and how fast. The agency has subsequently acknowledged that its models systematically underestimated solar deployment.
But a learning curve is not a promise. The rate could change for structural reasons. Silicon is already cheap enough that the module cost is increasingly dominated by glass, aluminium framing, encapsulant materials, and the silver used for cell contacts. Silver in particular — a commodity with its own supply constraints — has become the material where cost pressure concentrates, as the composition of a panel shifts and cell architectures try to reduce paste consumption. Further doublings will require finding savings in inputs that have not historically been the binding constraint.
There is also the question of what price is being measured. Module prices are not system prices. As modules have become cheaper, the balance of system — mounting structures, inverters, cables, grid connection, land and labor — has fallen more slowly. Lawrence Berkeley National Laboratory's annual tracking of US installed costs shows that the module fraction of total system cost has shrunk significantly; a continued fall in module prices alone delivers diminishing returns at the system level.
None of that cancels the record. For roughly fifty years, across different technologies, different geographies, different policy environments and different scales of operation, every doubling of cumulative photovoltaic production has been accompanied by a reduction in module price of around a fifth. The curve is one of the most durable empirical regularities in the history of energy technology. Whether the next doubling continues it is a question the data will answer only after it happens.